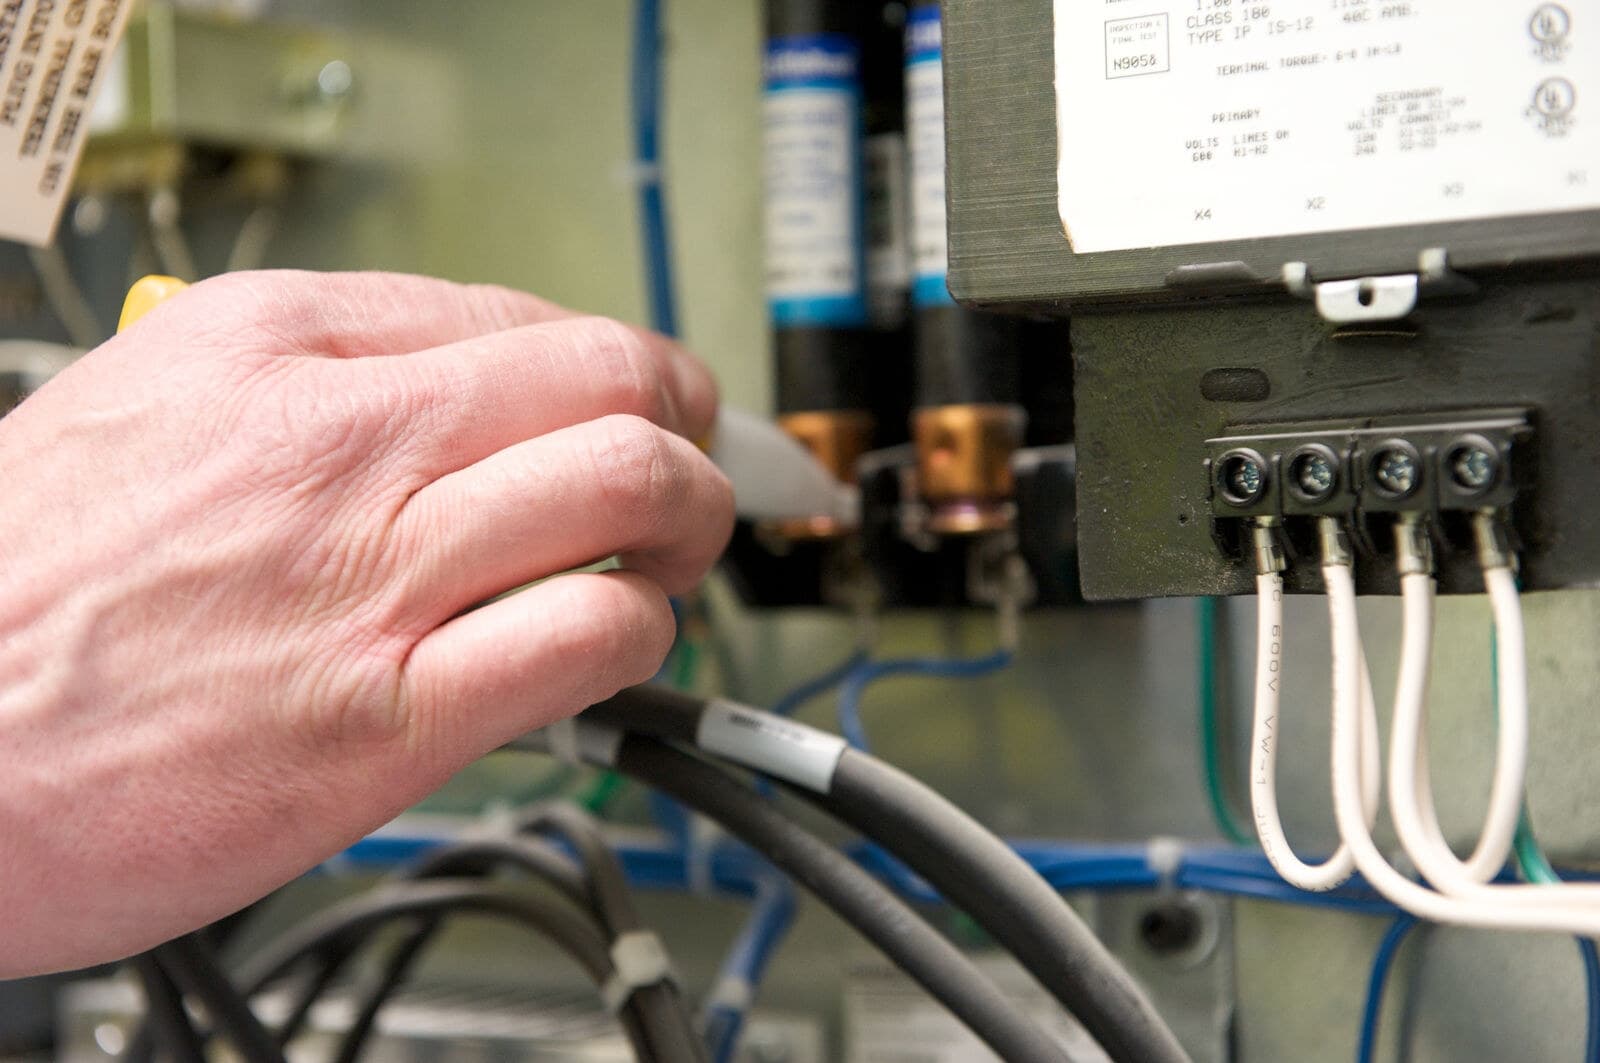
Permits
Annual State of Safety 2022
State of Safety 2022: Permits
We issue installation and operating permits to contractors and asset owners to promote work being done correctly and to connect them to the safety system. The data collected helps us track where regulated work is being done and by whom, should compliance and enforcement action be needed to correct unsafe work.
This repository of data makes for a stronger safety system as risks and trends are shared with the appropriate asset owners so that they can foresee any hazards tied to their equipment or systems.
112,645
Active operating permits in 2022
155,620
Installation permits issued in 2022
Installation Permits
In 2022, a total of 155,620 installation permits were issued, a 3% decrease compared to 2021.
Installation permits increased by 114% in the amusement devices technology in 2022. This is due to the re-opening of many amusement-based businesses after the pandemic health and safety orders were lifted in 2020 and 2021.
An Overall Decrease
Conversely, there was a 19% decrease of installation permits for boilers, pressure vessels, and refrigeration. Gas also saw a decrease of 12% for installation permits. This was likely due to the economic slowdown, which caused a decrease in housing permits and increased costs of materials and labour.

Operating Permits
There were 112,645 active operating permits in 2022, an increase of 6% compared to 2021.
The largest increases of operating permits in 2022 compared to 2021 can be seen in the amusement devices (32% increase) and electrical (28% increase) technologies.
The increase for the amusement devices technology was due to the re-opening of many businesses in this industry post pandemic.
Outreach Efforts
For the electrical technology, the increase was in part due to our outreach efforts in several regions to confirm clients had the appropriate operating permits for their regulatory work.
Operating Permits and Installation Permits by Year (2018-2022)
Operating Permits and Installation Permits by Category 2022
You Might Be Interested In
Building Confidence
We identify risks and increase safety by investigating and auditing companies without proper licenses and qualifications.
A Safer BC
Gas Line Safety, Climate Action and our Licensed Contractor Program
Safety Engagement
We provide technical training and education to support our partners. We also work to influence people in the safety system to make safety-minded decisions.